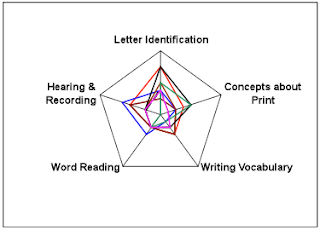
A star plot is a map that is used to show the relationship among different variables. There must be three or more variables being compared. The length of the data line represents the magnitude of the variable. The longer the line the more magnitude the variable has. The example star plot, pictured above, shows the result of a student observation test comparing the variables of letter identification, concepts about print, writing vocabulary, word reading and hearing and recording.
http://assessment.tki.org.nz/Assessment-tools-resources/Alignment-of-assessment-tools-with-National-Standards/Reading/Observation-Survey
No comments:
Post a Comment